|
Zplots Appendix 3 Resolving the Sign of X (VNA1 and miniVNA Only) |
|---|
This section applies only to users of the VNA1 and (original) miniVNA analyzers. These devices do not show the sign (positive or negative) of the reactance value X. Zplots contains special logic to help overcome this drawback.
One method that is often cited to determine the sign of X involves noting the change in the impedance magnitude (Zmag) between a lower frequency and a higher frequency. If the Z magnitude increases the sign of X is assumed to be positive and if the Z magnitude decreases the sign of X is assumed to be negative.
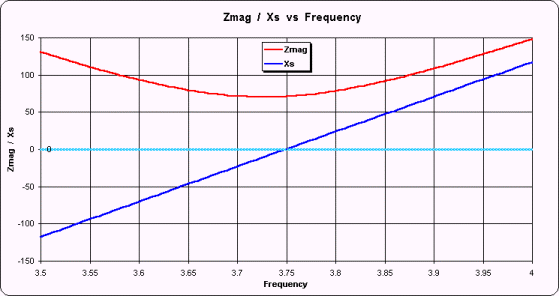
This method works for relatively simple configurations of discrete components when connected directly to the analyzer and for simple antennas when measured at the antenna feedpoint. For example, the following figure shows the Z and X values for an 80 meter dipole antenna that is resonant at 3.75 MHz.

The red line is the Z magnitude and the dark blue line is the reactance X. (The light blue horizontal line merely highlights 0 on the scale.) As can be seen, above 3.75 MHz where the Z magnitude is increasing the sign of X is positive and below 3.75 MHz where the Z magnitude is decreasing the sign of X is negative. On the VNA1 and miniVNA displays the trace line for X would always be positive, with a "V" in the middle, but this illustrates that the technique sometimes holds true.
However, if the same antenna were to be measured at the input end of 50 feet of RG-213 (chosen just as an example) the situation is not so clear. (On the following plot note that the scale has changed but the 0 value is still highlighted.)
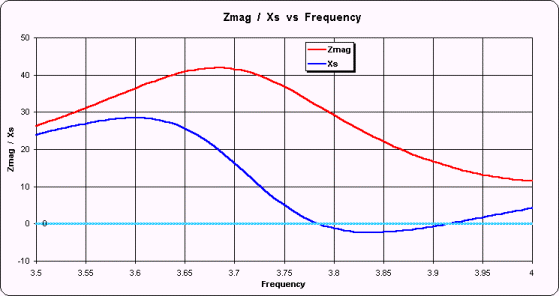
Here the magnitude of Z is increasing in the frequency range from 3.5 to just less than 3.7 MHz. In that range the sign of X is positive, as expected when Z magnitude increases. But the Z magnitude is decreasing from there until 4 MHz and in that span the sign of X is still positive for a while, then goes negative, then goes positive again. So if you did not know the sign of X and you used the simple "Z mag goes down means X is negative" you would be wrong over much of the frequency range.
Another technique for resolving the sign of X involves looking at the slope of the reflection coefficient phase angle. This also works in simple cases, but not for this example of taking measurements at the input end of a feedline.
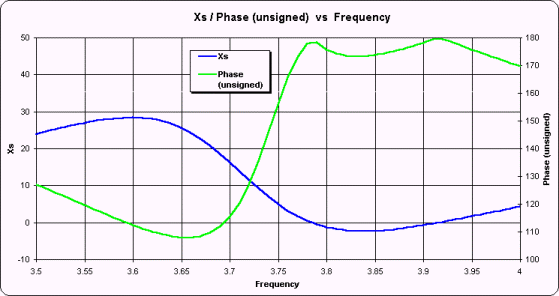
This plot shows X, both positive and negative, referenced to the left scale as before. The green line shows Phase, referenced to the right scale. The Phase values have been artificially altered to be unsigned, the same as would be shown on the VNA1 and miniVNA displays, except for clarity the scale range has been limited to
100-180 degrees instead of0-180 degrees. As you can see, there is no correlation between the slope of the Phase trace line and the sign of X.Below is a slightly more complicated measurement example, shown on Smith charts instead of XY charts.
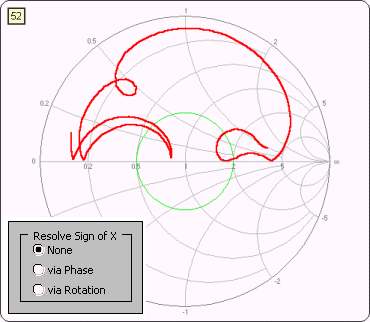
Here is what the Smith chart looks like when the sign of X is always positive. This is the 20M/15M trap dipole measured via 23 feet of RG-58 used in previous illustrations.
It is possible to make some "educated guesses" about the sign of X and Zplots has logic to do that. When you display VNA1 and miniVNA data with Zplots you will have three options for how you want to resolve the sign of X. The "None" option (at left) means to show the sign of X as always positive, the same as it is displayed on the VNA1 or miniVNA software.
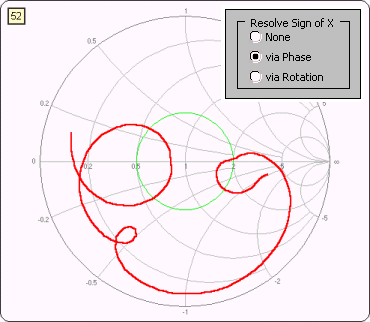
Here is exactly the same data as reported by the VNA1 or miniVNA device, except that one of two possible Zplots algorithms has been applied to determine the sign of X.
The "Phase" option looks for places where the Phase angle approaches 0 or 180 degrees and then does further processing to determine the correct sign for X. This option works in most cases and is the one you should try first.
The "Rotation" option works on the principal that the Smith chart trace should always rotate in a clockwise direction as the frequency increases. This option works even if the Phase angle does not approach 0 or 180 degrees but does not handle cases where the Smith trace has "closed loops" that are not centered on the middle of the chart, as at left.
For relatively simple cases either method will work. For extremely complex cases, such as measuring a multi-band antenna over a very wide frequency range, neither method may work. If you see "up-down jumps" on the Smith chart, where the sign of X swings rapidly between positive and negative values, it means that the sign of X was not determined correctly. It is amazingly easy for the human eye to see these shifts, and surprising difficult for a "blind" computer program to do the same.
You will see the three option buttons only when the input data to Zplots comes from either the VNA1 or miniVNA analyzer. If you choose one of the correction algorithms the corrected sign will also be shown on the various traces of the Custom XY chart that are dependent on the correct sign of the reflection coefficient angle, including Xs, Theta, Phase, and others.