|
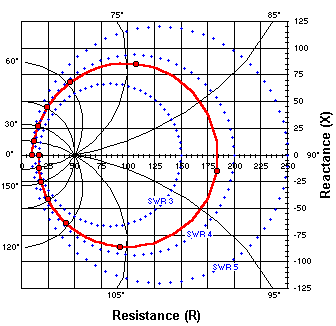
This is a rectangular plot of the impedance values at points along the ½ wavelength section of RG-174.
The straight grid lines show resistance and reactance while the
curved grid lines, with corresponding numbers around the perimeter of the chart, show the distance from the load
in electrical degrees. Recall that the red markers
represent 15 electrical degree increments along the transmission line. Unlike on a normal Smith chart,
these plotted points are not "evenly spaced" around the spiral.
This chart also has three SWR circles marked. Note that the circles do not share a common center.
However, the SWR circles are orthogonal to the curved grid lines that show the distance from the load,
and of course the resistance and reactance grid lines are orthogonal.
(Derived from Fig 1.2 of Phillip H. Smith, Electronic Applications of the Smith Chart, Noble Publishing, 1995, pg. 3.)
|

|
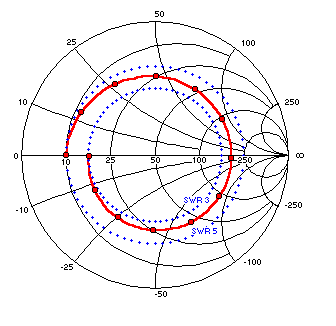
Here are the same impedance points shown on a Smith chart, including 3:1 and 5:1 SWR circles.
(The 4:1 circle was omitted for clarity.)
On this abbreviated chart there are no numbers showing distance from the load. On standard printed charts
there are separate numbers around the chart perimeter for this purpose, usually marked in wavelengths rather than electrical
degrees. If "grid lines of constant distance from load" were shown they would radiate
outward from the center of the chart like straight spokes of a wheel.
On the Smith chart, just like on the rectangular chart above, the lines of constant SWR (blue circles) are orthogonal to the
lines of constant distance from load (wheel spokes, not shown), and the resistance grid lines are orthogonal to the reactance grid lines.
Phillip Smith recognized this symmetry, allowing him to progress from the rectangular form (1931) to the circular form (1939).
Over sixty years later and it's still going strong!
|

